
IAO measurement dashboard

Observations at a glance.
Context one click away.

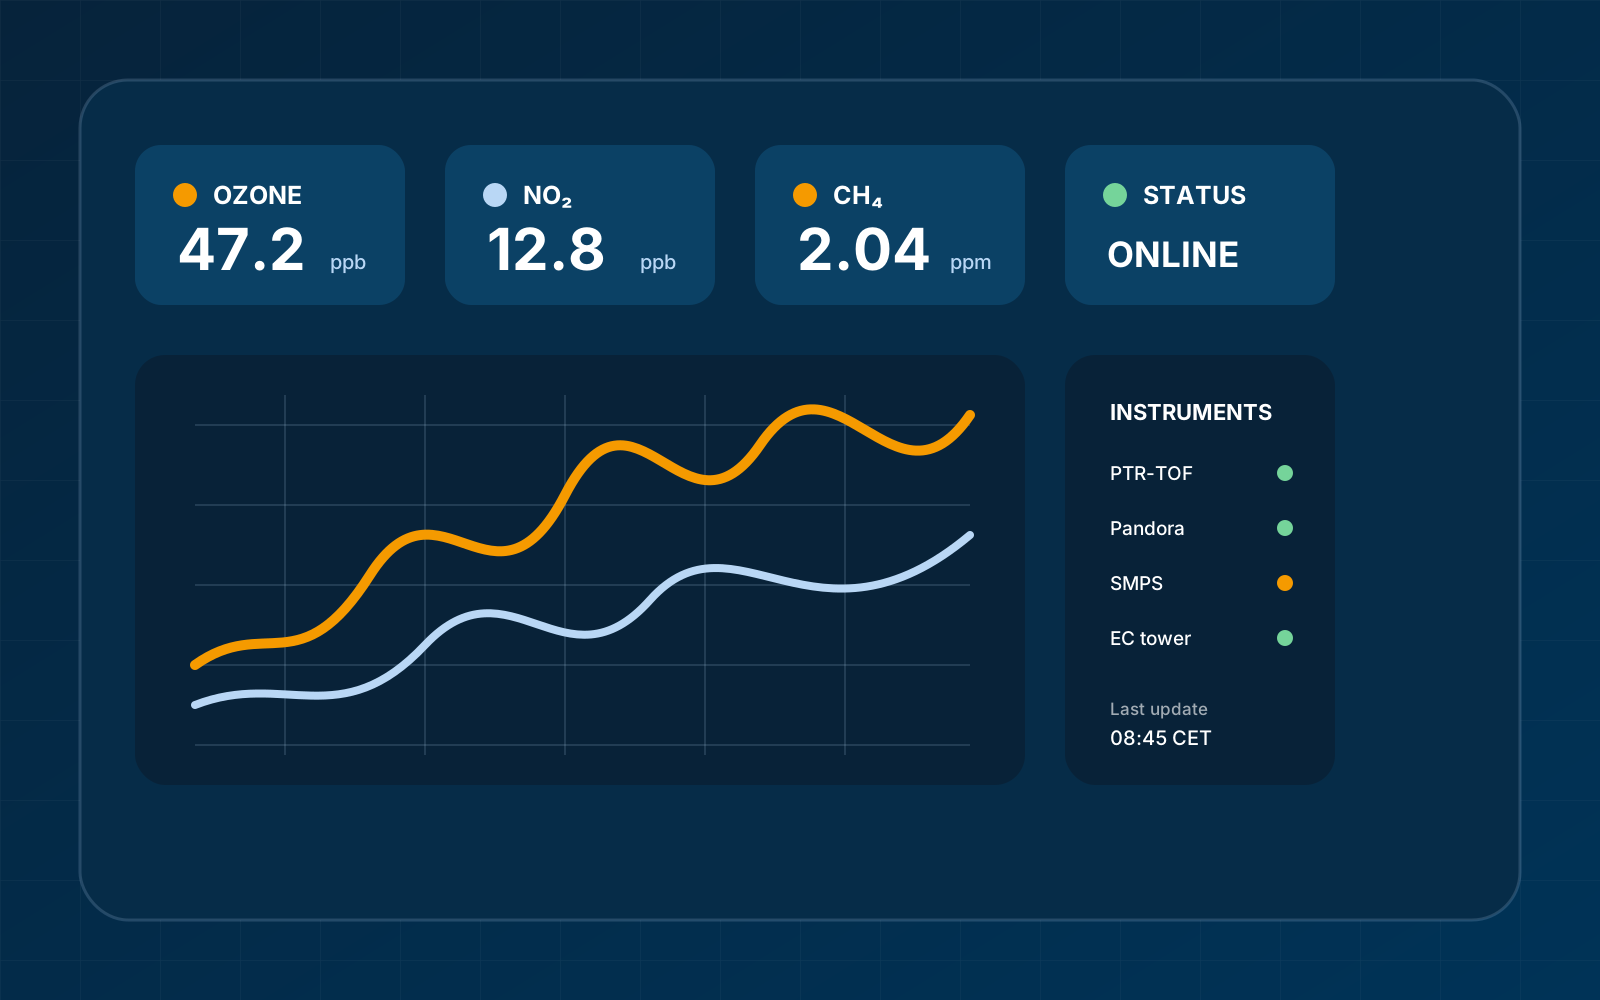
The future IAO dashboard brings together selected variables, quality status and instrument availability.
Demo dataTime seriesQuality flagsInstrument status
Illustration of a scientific data dashboard

Site context

Live views around the IAO.

The camera images complement future measurements with a direct visual impression of current conditions.

Concept module: all values and time series shown below are illustrative. They are not live observations and must not be used scientifically.
O₃demo
41.8 ppb
+3.1% vs. previous
NO₂demo
14.6 ppb
−5.4% vs. previous
CH₄demo
2.04 ppm
+0.6% vs. previous
CO₂demo
421.5 ppm
−1.2% vs. previous
Winddemo
2.8 m s⁻¹
WNW · example

Trace-gas example series

Illustrative values · no scientific use

O₃NO₂

Instrument status (demo)

PTR/SRI-qiTOFMSavailable
Pandora DOASavailable
NOx analyseravailable
Flux toweravailable
VOCentinelmaintenance (demo)

Measurement data & quality

Quality-controlled measurement data.

Selected time series are provided with timestamps, quality flags and maintenance status. Raw data, preliminary observations and validated data products remain clearly separated.