Longterm urban eddy covariance observations of methane and other trace gases reveal characteristic anthropogenic emission hotspots
Extended Poster EGU25-5202
Synopsis: Long-term urban eddy covariance observations of methane, CO2 and other trace gases allow to constrain important emission sources. We find that most methane is released activity driven towards the top of the urban inertial sublayer (and not necessarily only at ground level) via post-meter emissions from gas furnace operations. Unburned methane then escapes through chimneys into the urban atmosphere.
Our findings have important ramifications for methane assessments in urban areas. Methane emissions in urban areas are not only distributed horizontally, but also show a significant variation in the vertical dimension. Failure to constrain the vertical structure of urban methane concentrations or incorrect source location assumptions can lead to significant underestimation of urban methane fluxes. Urban eddy covariance observations can overcome these limitations.
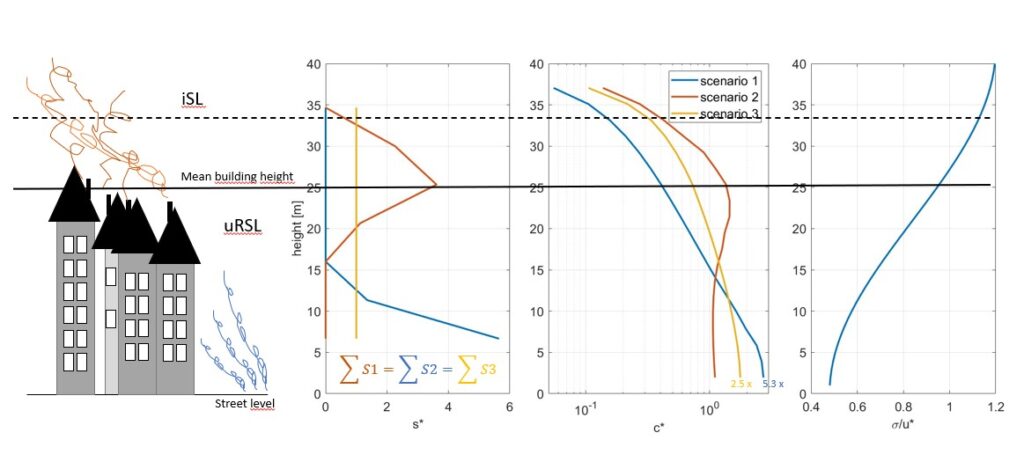
Fig. 1 Schematic of the urban boundary layer: uRSL (urban roughness sublayer), iSL (inertial sublayer), s* normalized source distribution, c* normalized concentration profile. Three scenarios (S1: emissions at roof tops, S2: emissions at street level, S3: uniform emissions throughout the uRSL)
Fig. 1 shows the inherent biases of urban methane emissions, depending on the assumption of the vertical source distribution. While the total methane emissions (s*) for the three scenarios are the same, the vertical distribution varies substantially. With emissions occurring at roof-top the concentration (c*) at street level can be up to a factor of 5 lower. The concentration averaged over the uRSL is 2.2 times higher in S2 than in S1. The model simulation was conducted using an inverse lagrangian transport model (ILT) (e.g. Karl et al., 2008: https://doi.org/10.5194/bg-5-1287-2008 ) using measured turbulence profiles at IAO+.
Why are EC observations useful? New in-situ spectroscopic techniques for methane provide unprecedentedly low detection limits making EC observations tractable. They are able capture all emissions within the flux footprint. Figure 2 summarizes data from 2 years of EC observations in Innsbruck, converted to an area aggregated emission in t/h, and compares it to typical detection limits from GHG satellite derived emissions estimation. Most urban CH4 emissions are diffuse and lead to overall emission fluxes that are about 1 order of magnitude below the LOD of current remote sensing technology.

Fig. 2 Comparison between measured urban CH4 fluxes and theoretical detection limits of GHG satellites.
IAO flux tower (https://doi.org/10.1175/BAMS-D-19-0270.1) :
The following images provide more detail on the flux tower in Innsbruck, that has been operational since about 2017.
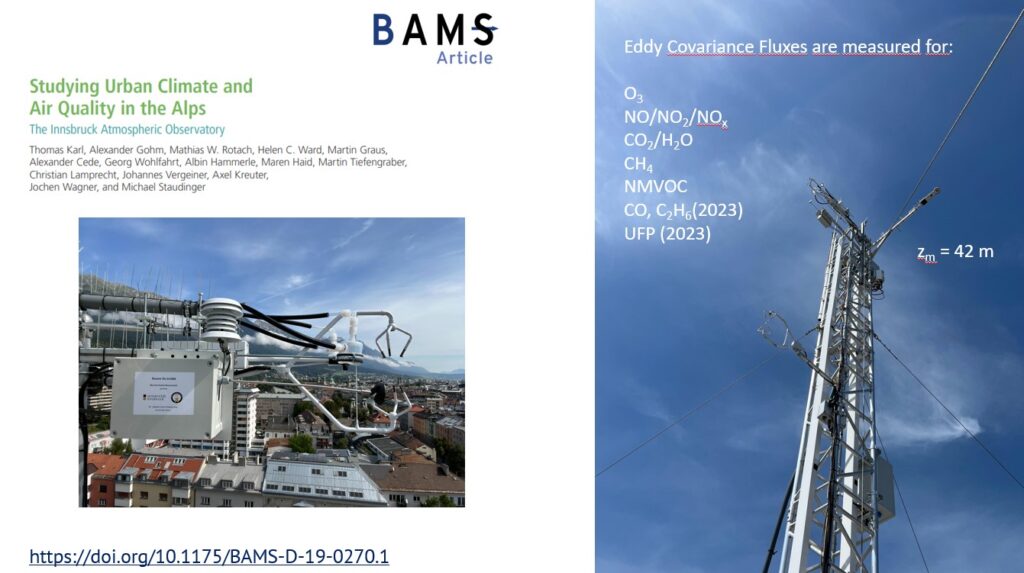

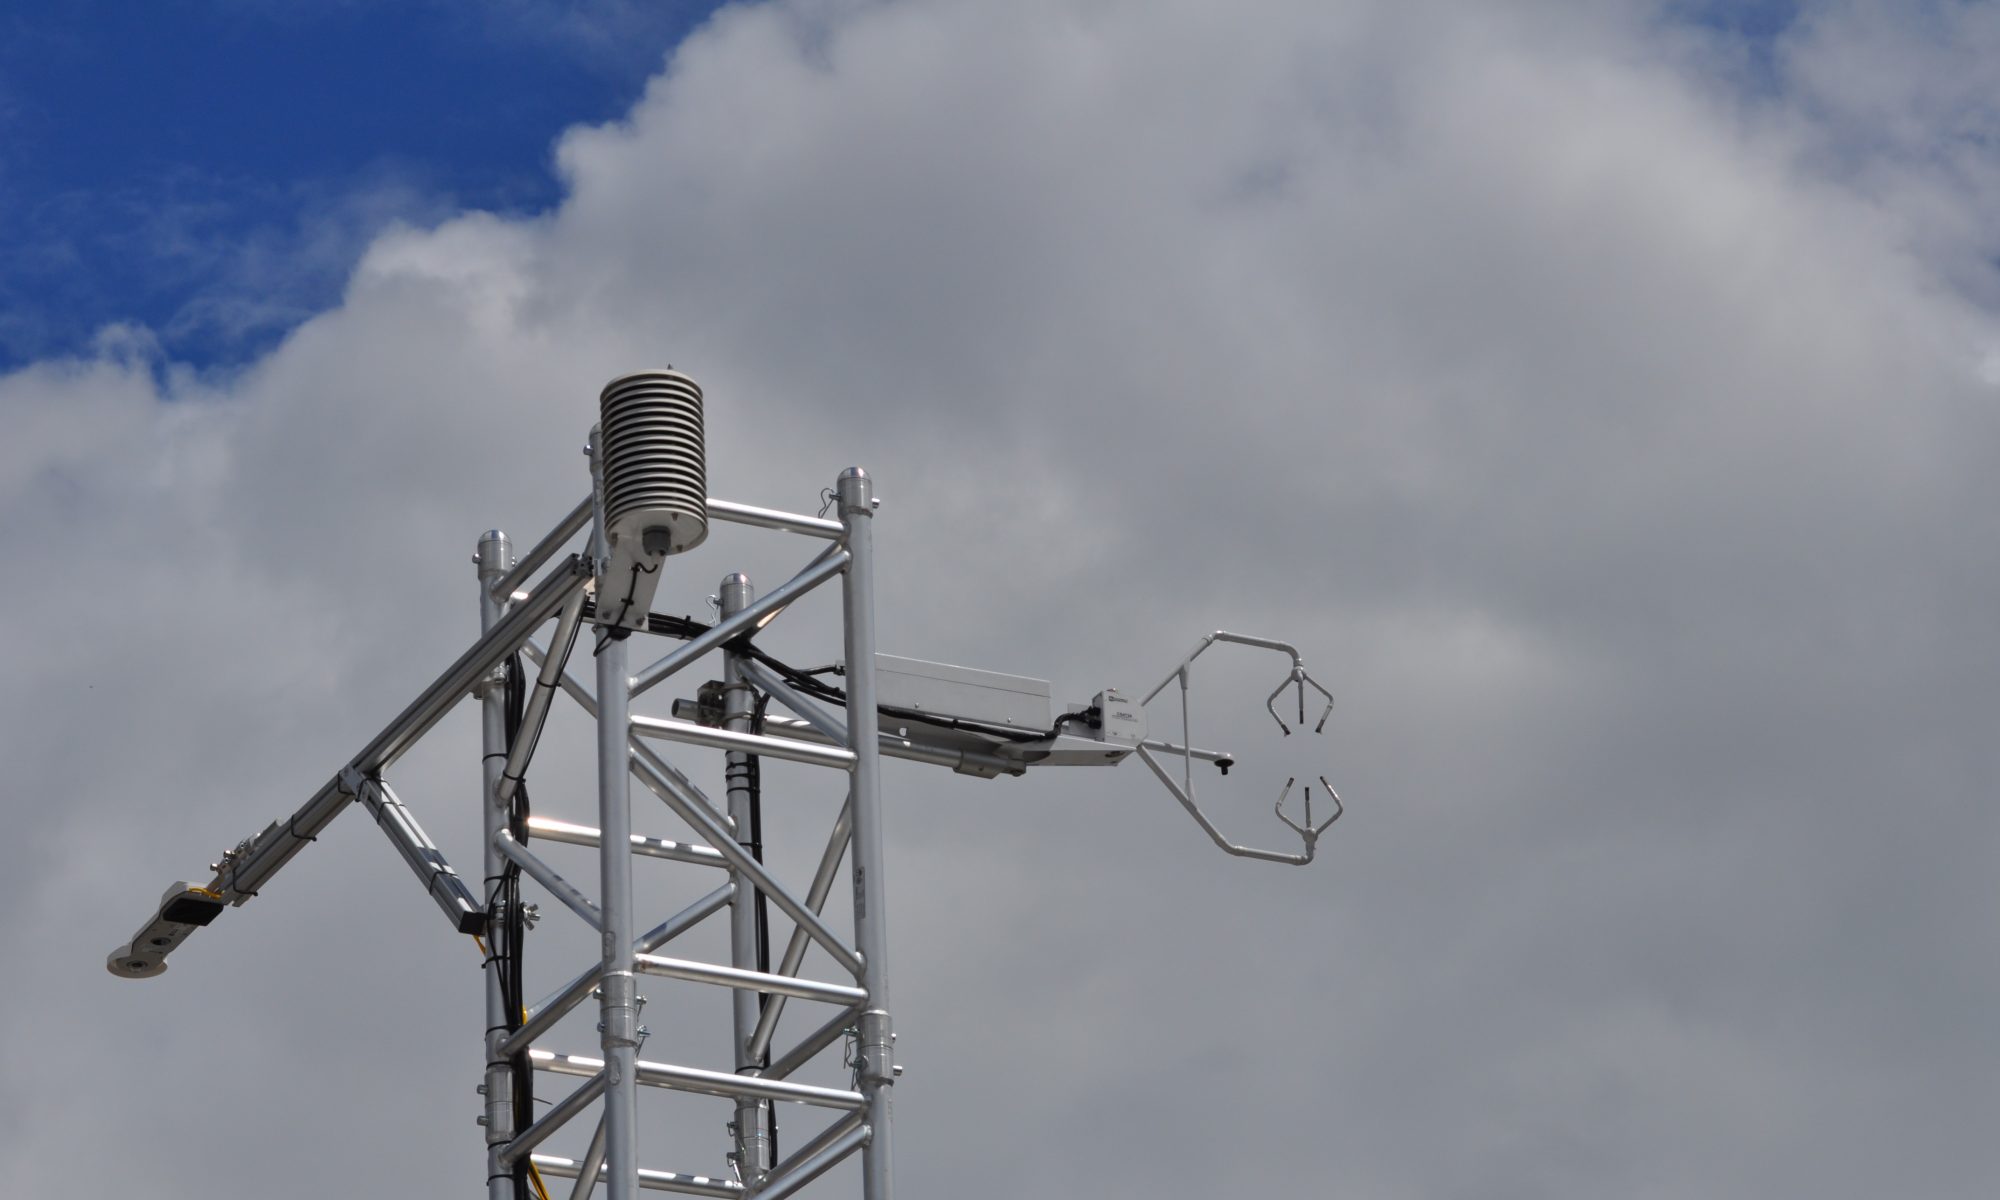
Fig. 3 (a) IAO top sampling location at 42m above street level, (b) top view of IAO and street canyon turbulence profile (IAO+)
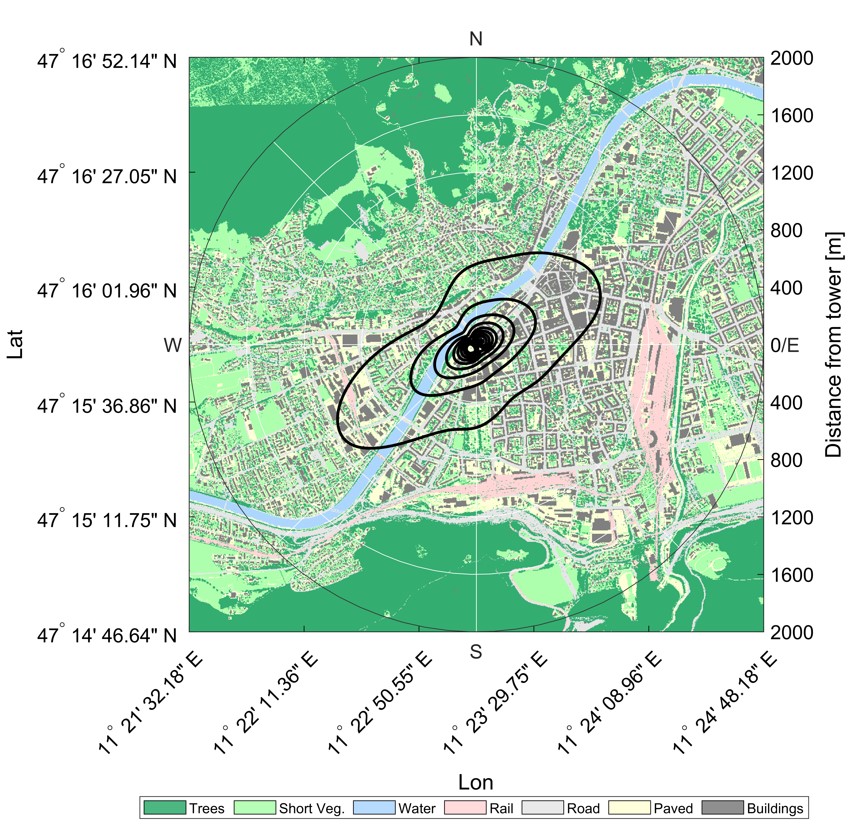
Fig. 4 Climatological flux footprint (footprint according to Kljun et al., 2015: https://doi.org/10.5194/gmd-8-3695-2015; landuse according to Ward et al., 2022: https://doi.org/10.5194/acp-22-6559-2022)
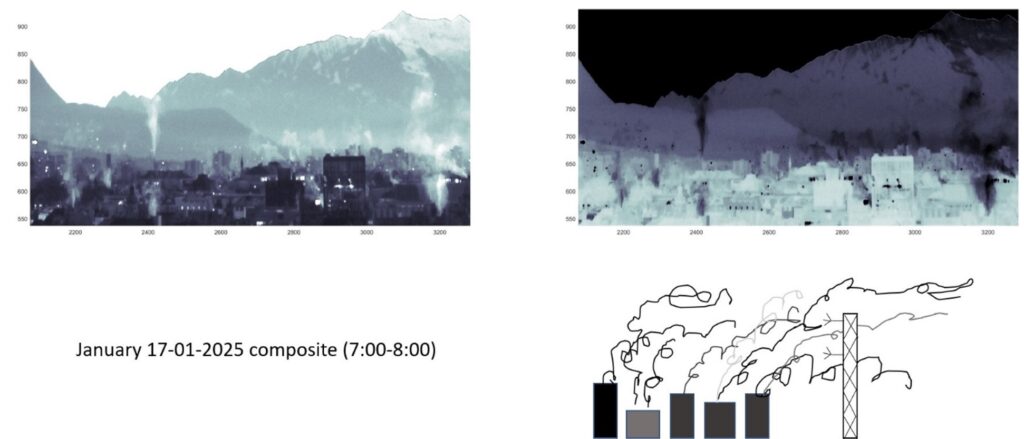
Fig. 5 Example photo on January 17th 2025 (looking east), highlighting urban energy use and fosil fuel combustion
Methane flux observations:
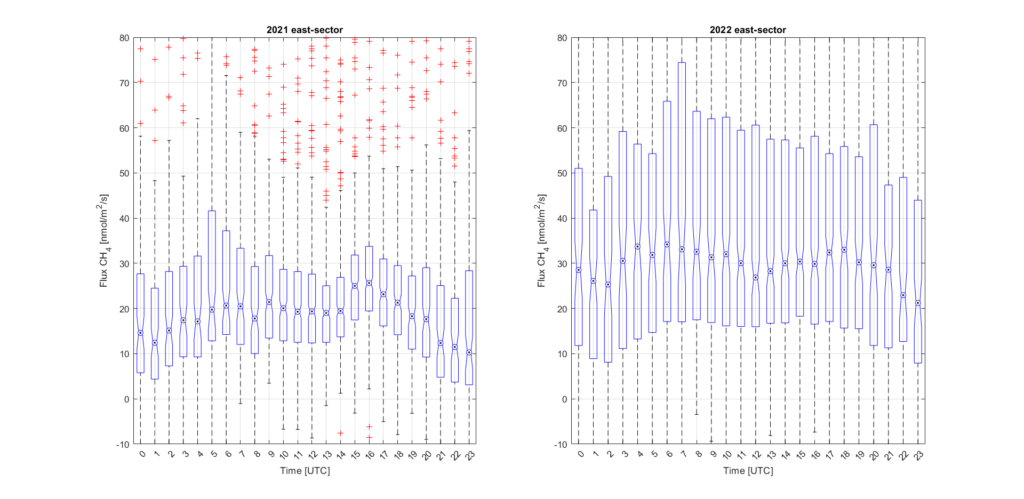
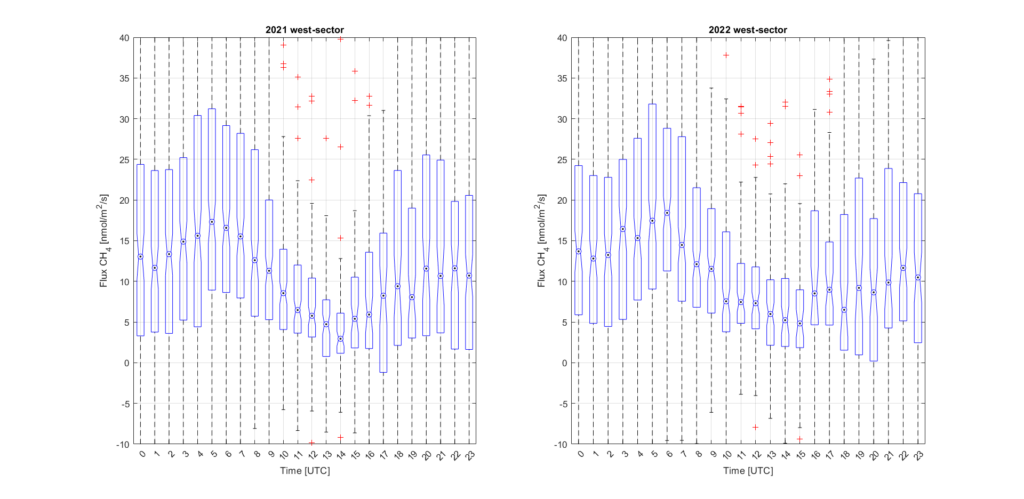
Fig. 6: Typical Methane Fluxes observed in two years for east and west sector.
Annual mean methane and carbon dioxide fluxes were on the order of 21.6 nmol/m2/s and 11.7 μmol/m2/s respectively. Methane fluxes increased significantly with decreasing temperature and showed a negligible weekend to weekday effect. Accompanying non-methane volatile organic compound (NMVOC) measurements provided additional constraints on urban methane sources during an intensive 6-week campaign in 2021. Positive matrix factorization analysis identified a unique and dominant methane source. Contributions from biomass burning and vehicle emissions were found to be small. No evidence was found for a large unknown biogenic source.
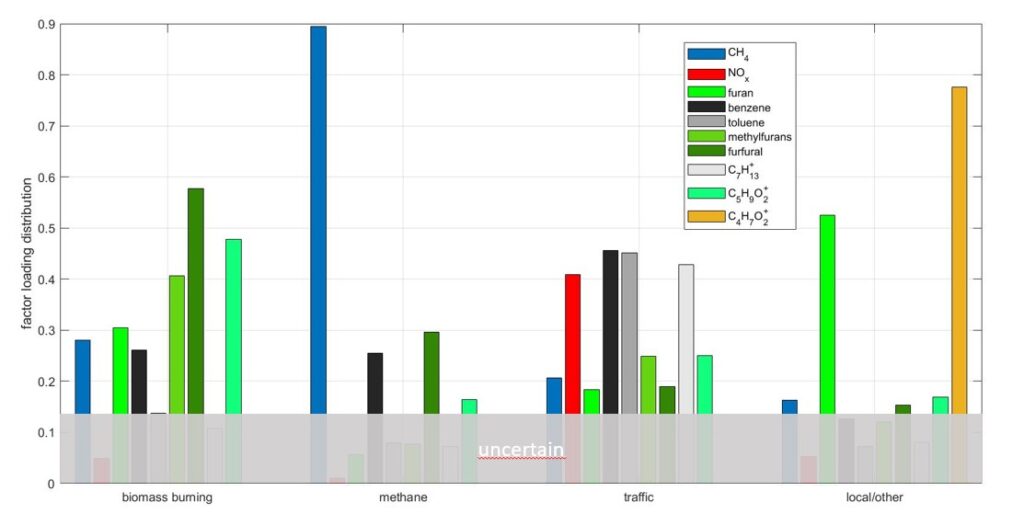
Fig. 7: PMF analysis of selected NMVOC, NOx and CH4 fluxes grouped according to assigned emission source. NMVOC assignments and protonated masses are given as following: furan (C4H4O.H+), benzene (C6H6.H+), toluene (C7H8H+), methylfurans (C5H6OH+), furfural (C5H4O2H+), cycloheptene and isomers (C7H12H+), C5 (C5H6O2H+) and C4 oxygenated (C4H6O2H+) VOCs (e.g. ethyl- and methyl acrylates and isomers) (Stichaner et al., 2024: https://doi.org/10.1016/j.atmosenv.2024.120743 )
During a campaign in 2024 we measured ethane to methane fluxes for the first time and confirmed earlier evidence of natural gas consupmtion as a major urban methane source, with ethane / methane ratios close to the composition of natural gas delivered to Tyrol and Southern Germany:
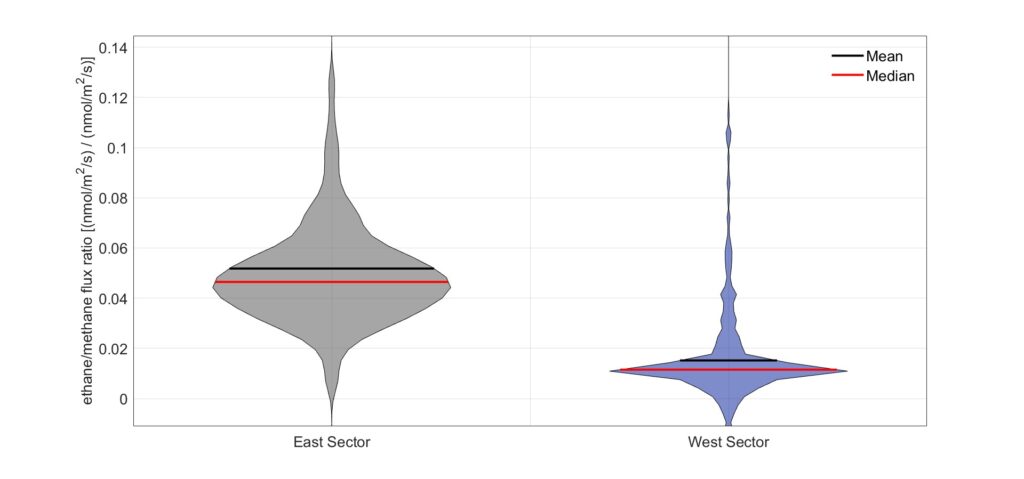
Fig. 8: Distribution plot of ethane to methane flux ratios for November 2024
The temperature dependence of methane fluxes is negative and follows statistical data on gas use in Innsbruck, suggesting increased emissions due consumption of natural gas. This provides an indirect evidence that observed methane emissions are largely not due to gas leaks (which would be independent of temperature):

Fig 9: Temperature dependence of methane fluxes at the IAO (adapt