Current Situation of SARS-CoV2 and Air Quality
PUBLICATION: ACP – Decoupling of urban CO2 and air pollutant emission reductions during the European SARS-CoV-2 lockdown
The 2019 SARS-CoV2 pandemic has far reaching ramifications for global healthcare systems, society and the economy. A great deal of information about epidemiology, economic impacts and the subsequent societal cost can be found on the internet. A good analysis and summary of options, decision makers are currently facing, is presented in this article: The hammer and the dance (EN version, DE version)
Google resources: https://google.org/crisisresponse/covid19-map
What is the current situation in important European economies, Austria and the US?
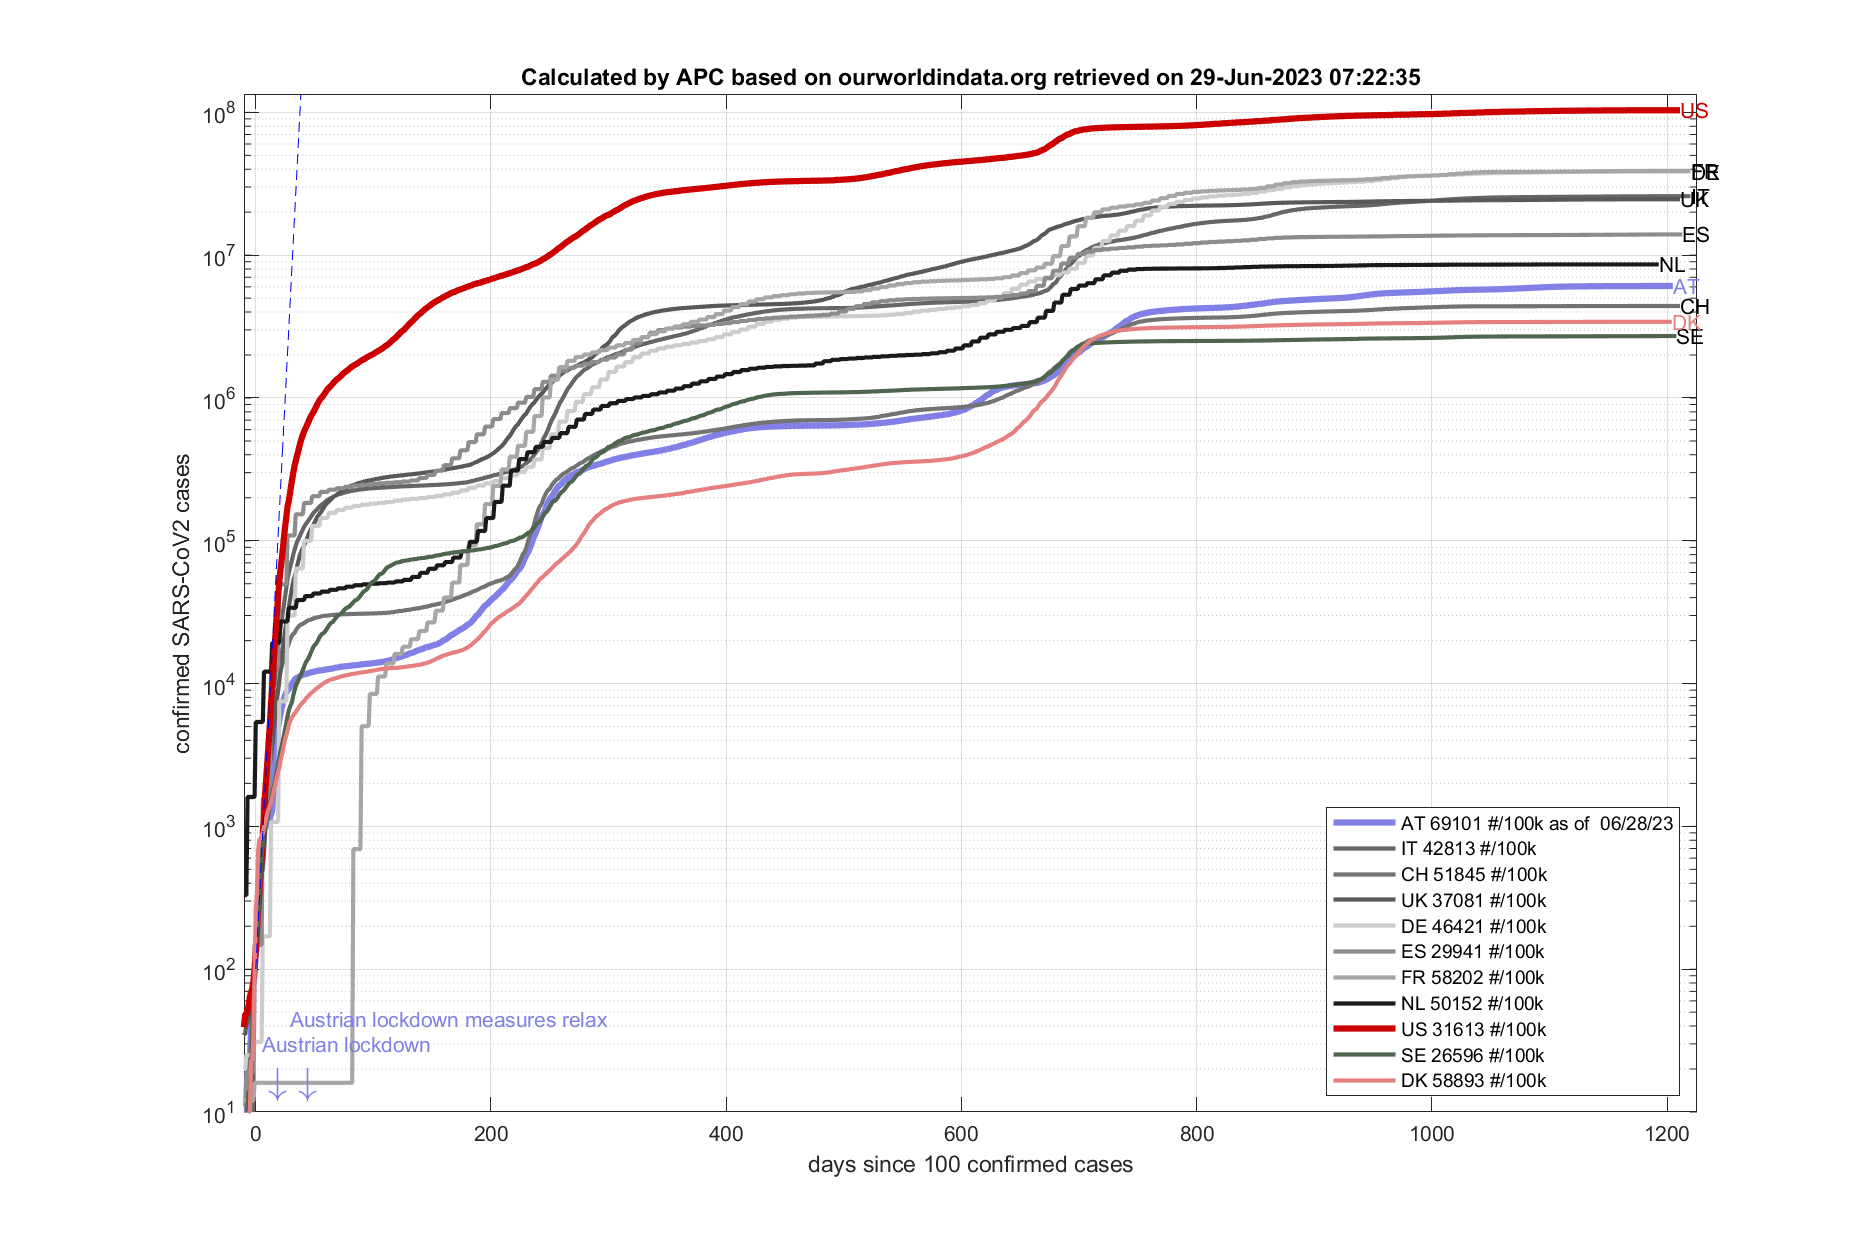
Fig. 1: Current SARS-CoV2 cases in comparison. Calculations are daily updated and visualized by the APC group. data source: www.ecdc.europa.eu
Fig.1 (click on image to enlarge) shows the current number of confirmed cases and is updated every day using public data from the European Center for Disease Prevention and Control. These curves will be interesting to follow in the next few weeks as different countries have taken different initial measures and strategies to deal with the pandemic (more plots can be found in this blog post) – a personal informed opinion based on media reports, government reports and The hammer and the dance is summarized as following:
- Italy: early lock down, but difficulty in minimizing social distancing of the Italian population – e.g. cell phone activity has been used to track people, suggesting a 40% mobility during lockdown – as of mid March Chinese experts have been working with Italian officials and are recommending stricter lockdown measures – the Italian government was (i.e. 03/24/2020) considering stopping non-essential industrial production and limiting access to gas stations.
- Spain: situation might be similar to Italy
- Austria: due to it’s proximity to Italy and heavy tourist industry, Austria, and particularly the state of Tyrol, have imposed a rapid lockdown in Mid March. The first lockdown was imposed after 655 confirmed cases were reported nationwide (i.e. day 5 Fig. 1 and 2). The state of Tyrol has been set under a complete quarantine on March 19 2020. As of 03/24/2020 the prospect of a longer disruptive period (ie. after 04/13/2020) is increasing. The statewide quarantine was lifted in Tyrol adopting the Austrian lockdown measures on 04/07/2020.
- Germany: has followed a more gradual course of ‚The Hammer‘ and has delayed heavy lockdown and social distancing measures compared to Austria by 1-2 weeks; as of 03/23/2020, social distancing measures have been increasing.
- Switzerland: with a population size comparable to Austria, Switzerland has about twice as many confirmed cases. Switzerland has delayed initial early lockdown, and is propagating less stringent lock down and shelter in place measures
- Netherlands, UK, Sweden and US: these countries have significantly delayed their early response to the outbreak and instead followed various mitigation (rather than suppression) strategies. The UK has shifted towards stricter suppression methods as of March 23 2020. The US has also implemented stricter guidelines, but various states follow different levels of restriction. As of April 1st 2020 Sweden is one of the few countries left, that does not mandate stringent suppression measures following this study.
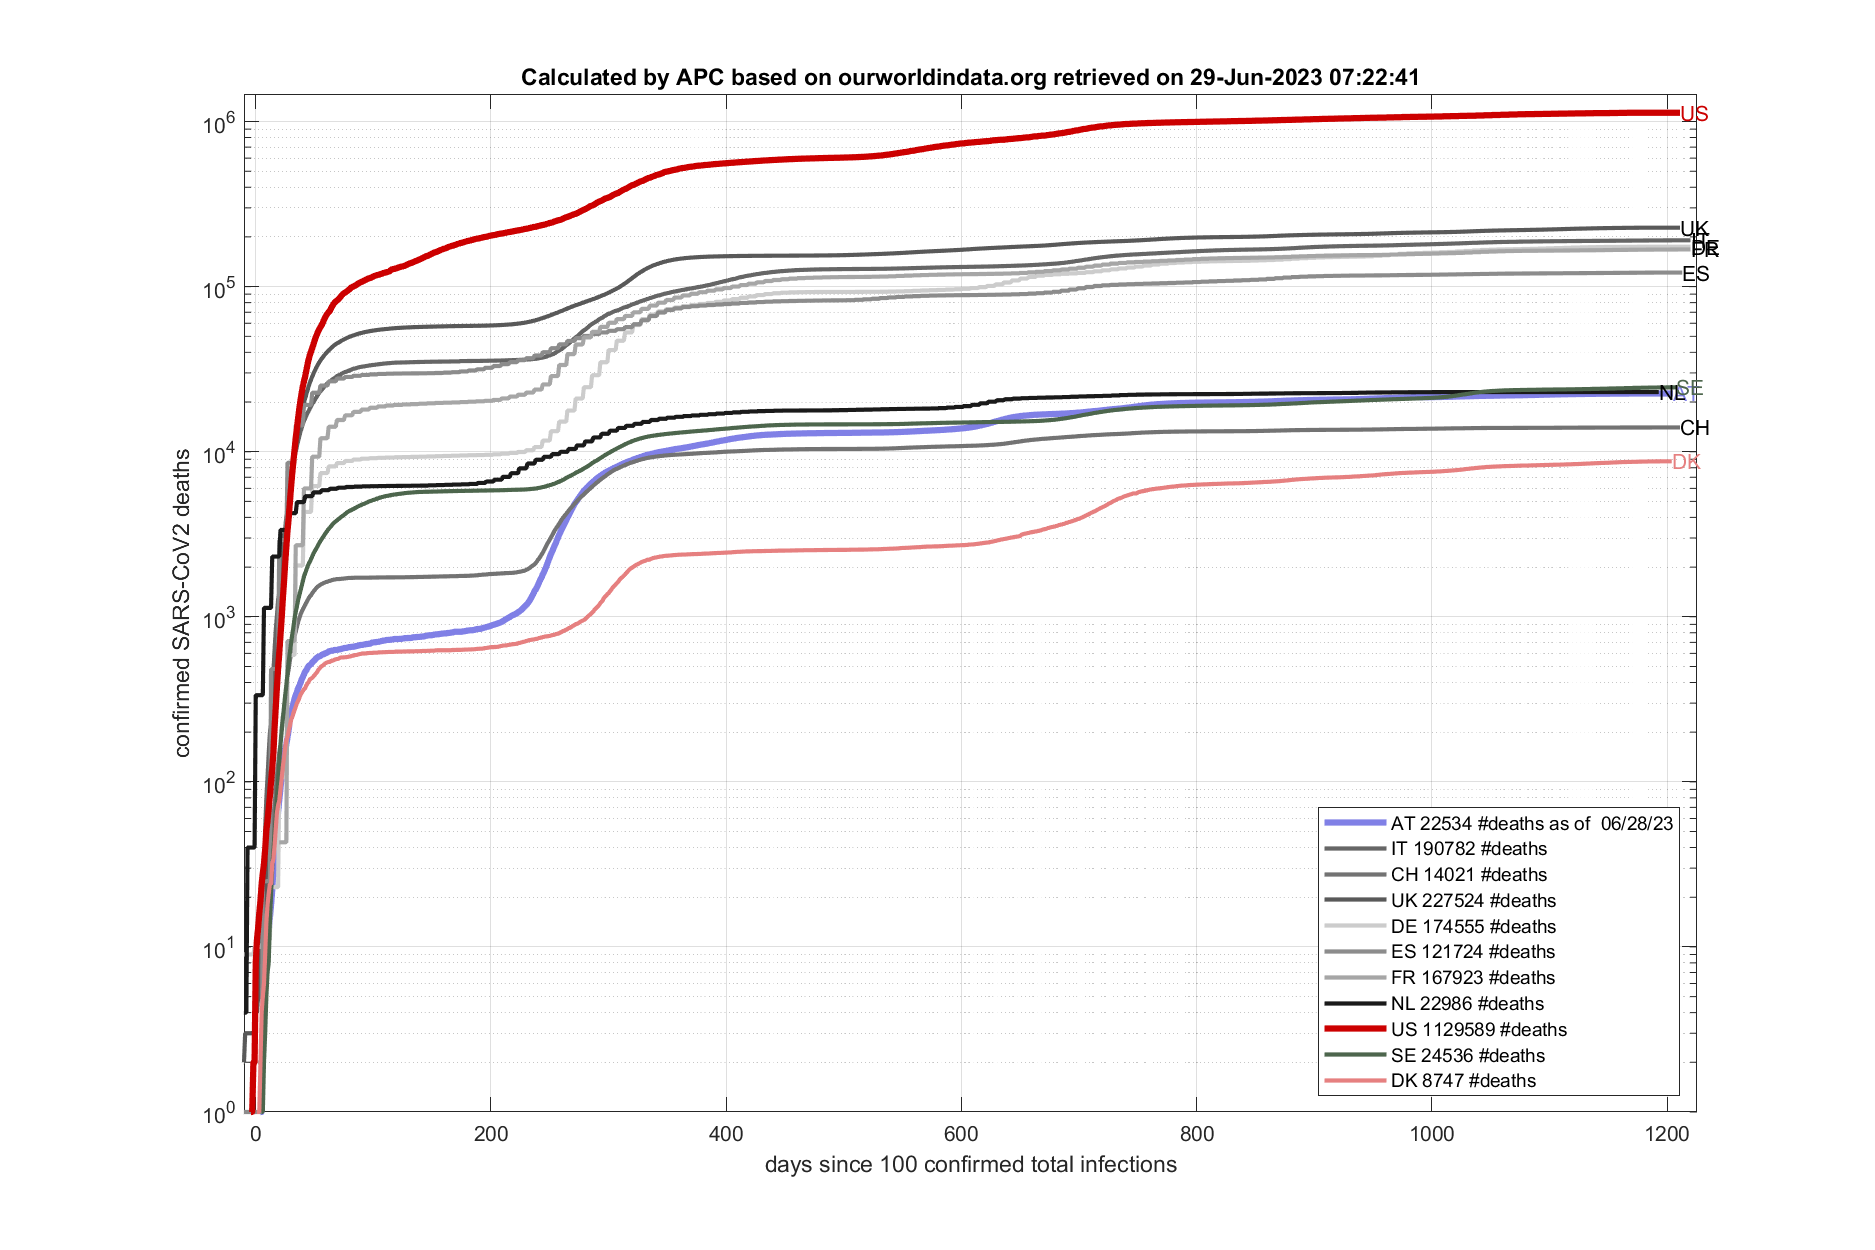
Fig. 2: Current SARS-CoV2 deaths. Calculations are daily updated and visualized by the APC group. data source: www.ecdc.europa.eu
SARS-CoV2 and Air Quality
Due to extensive worldwide suppression measures, impacting every aspect of daily life (in particular mobility) and industrial production, the impact on air quality and the emission of climate gases has received increasing attention. In fact, some have already considered current developments as the largest global environmental mitigation experiment in human history. Satellite imagery from ESA and NASA has for example documented significant declines in vertical column densities of NO2 (nitrogen dioxide) over China, Europe and the US. NO2 is a good proxy for air pollution and allows having a first qualitative estimate about impacts of an economic shock on the output of polluting gases (see linked references above). The interpretation of these data is still at the very beginning, because meteorological factors largely mask the real effect of shutdown measures on the actual emission reduction of air pollutants.
What is the situation in Tyrol (Innsbruck)?
The Innsbruck Atmospheric Observatory (IAO) at the University of Innsbruck is in a unique position to study the effects of mass quarantine on urban air quality due to
- the drastic suppression measures (i.e. the hammer) imposed quite early during the pandemic,
- long-term in-situ and remote sensing datasets that serve as reference, and
- an air quality study conducted from February to April 2019, which can serve as an additional reference period.
To give an impression of the situation in the city center of Innsbruck, Fig.3 shows how the rush hour looked like at a normally busy, congested intersection during the first week of lockdown (ie. quarantine), which is anticipated to last for 4-5 weeks.
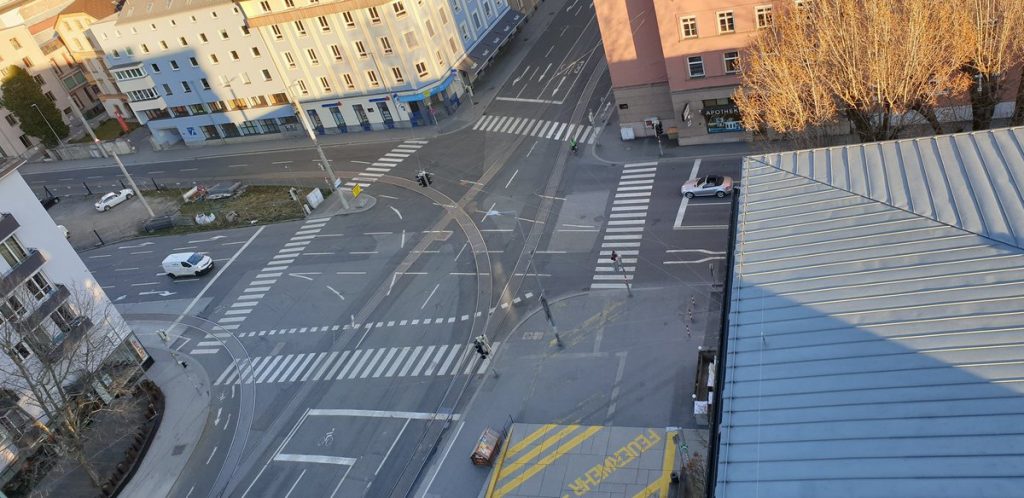
Fig. 3: Rush hour during lock down in Innsbruck: 18.3.2020
Preliminary Data at the IAO
In-situ observations
AQ measurements at the IAO
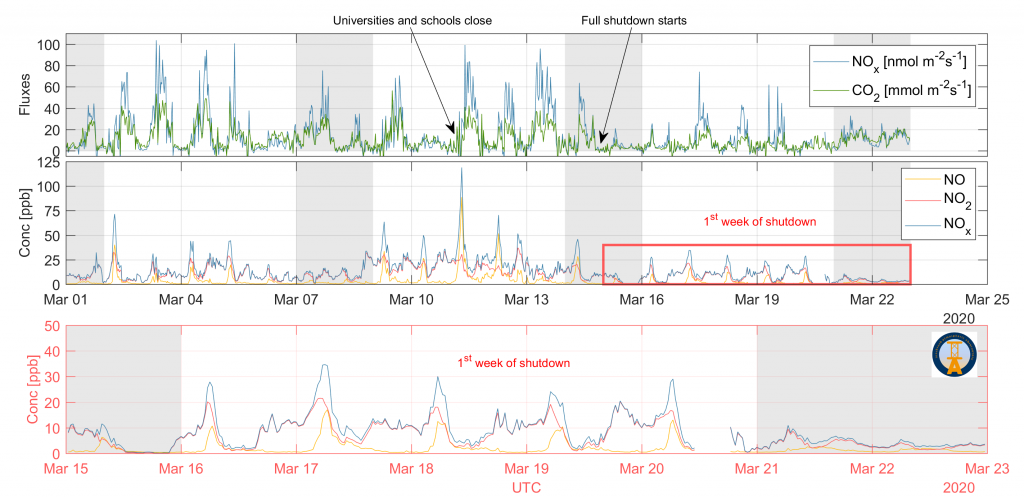 Fig. 4: Emissions and concentrations of NO, NO2, NOx and CO2 before and during the first week of lookdown: data source: IAO, UIBK
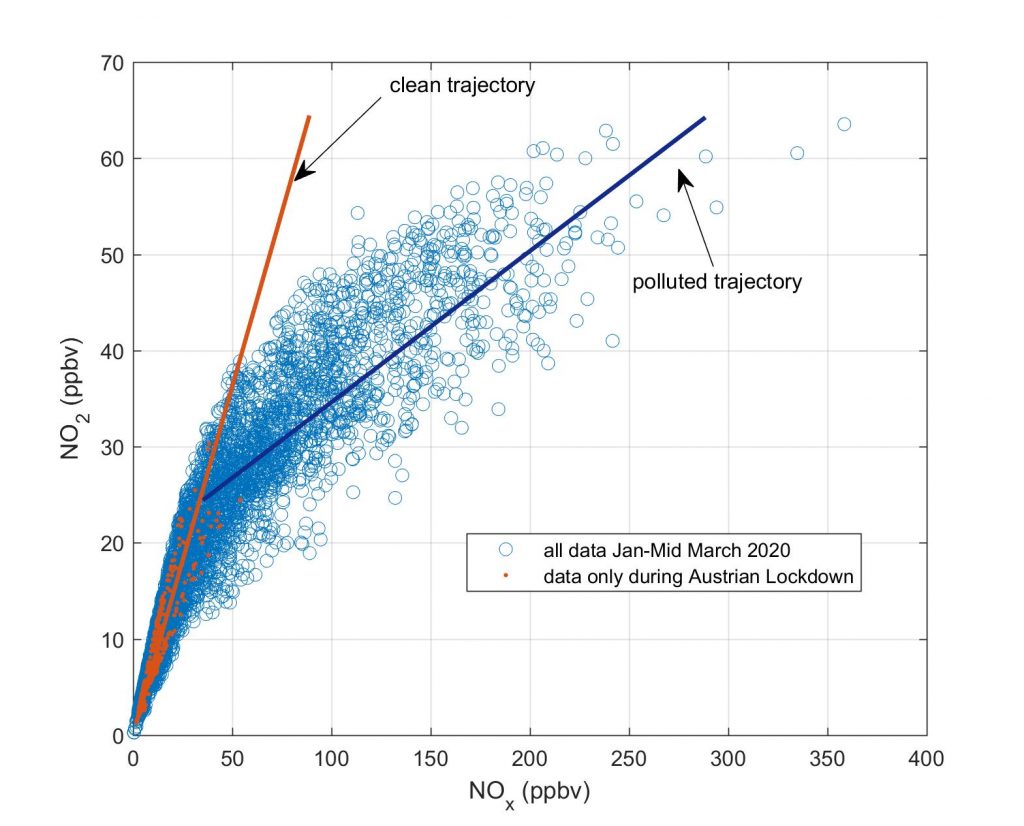
Fig 5a: Sensitivity of NO2 vs NOx in a polluted atmosphere
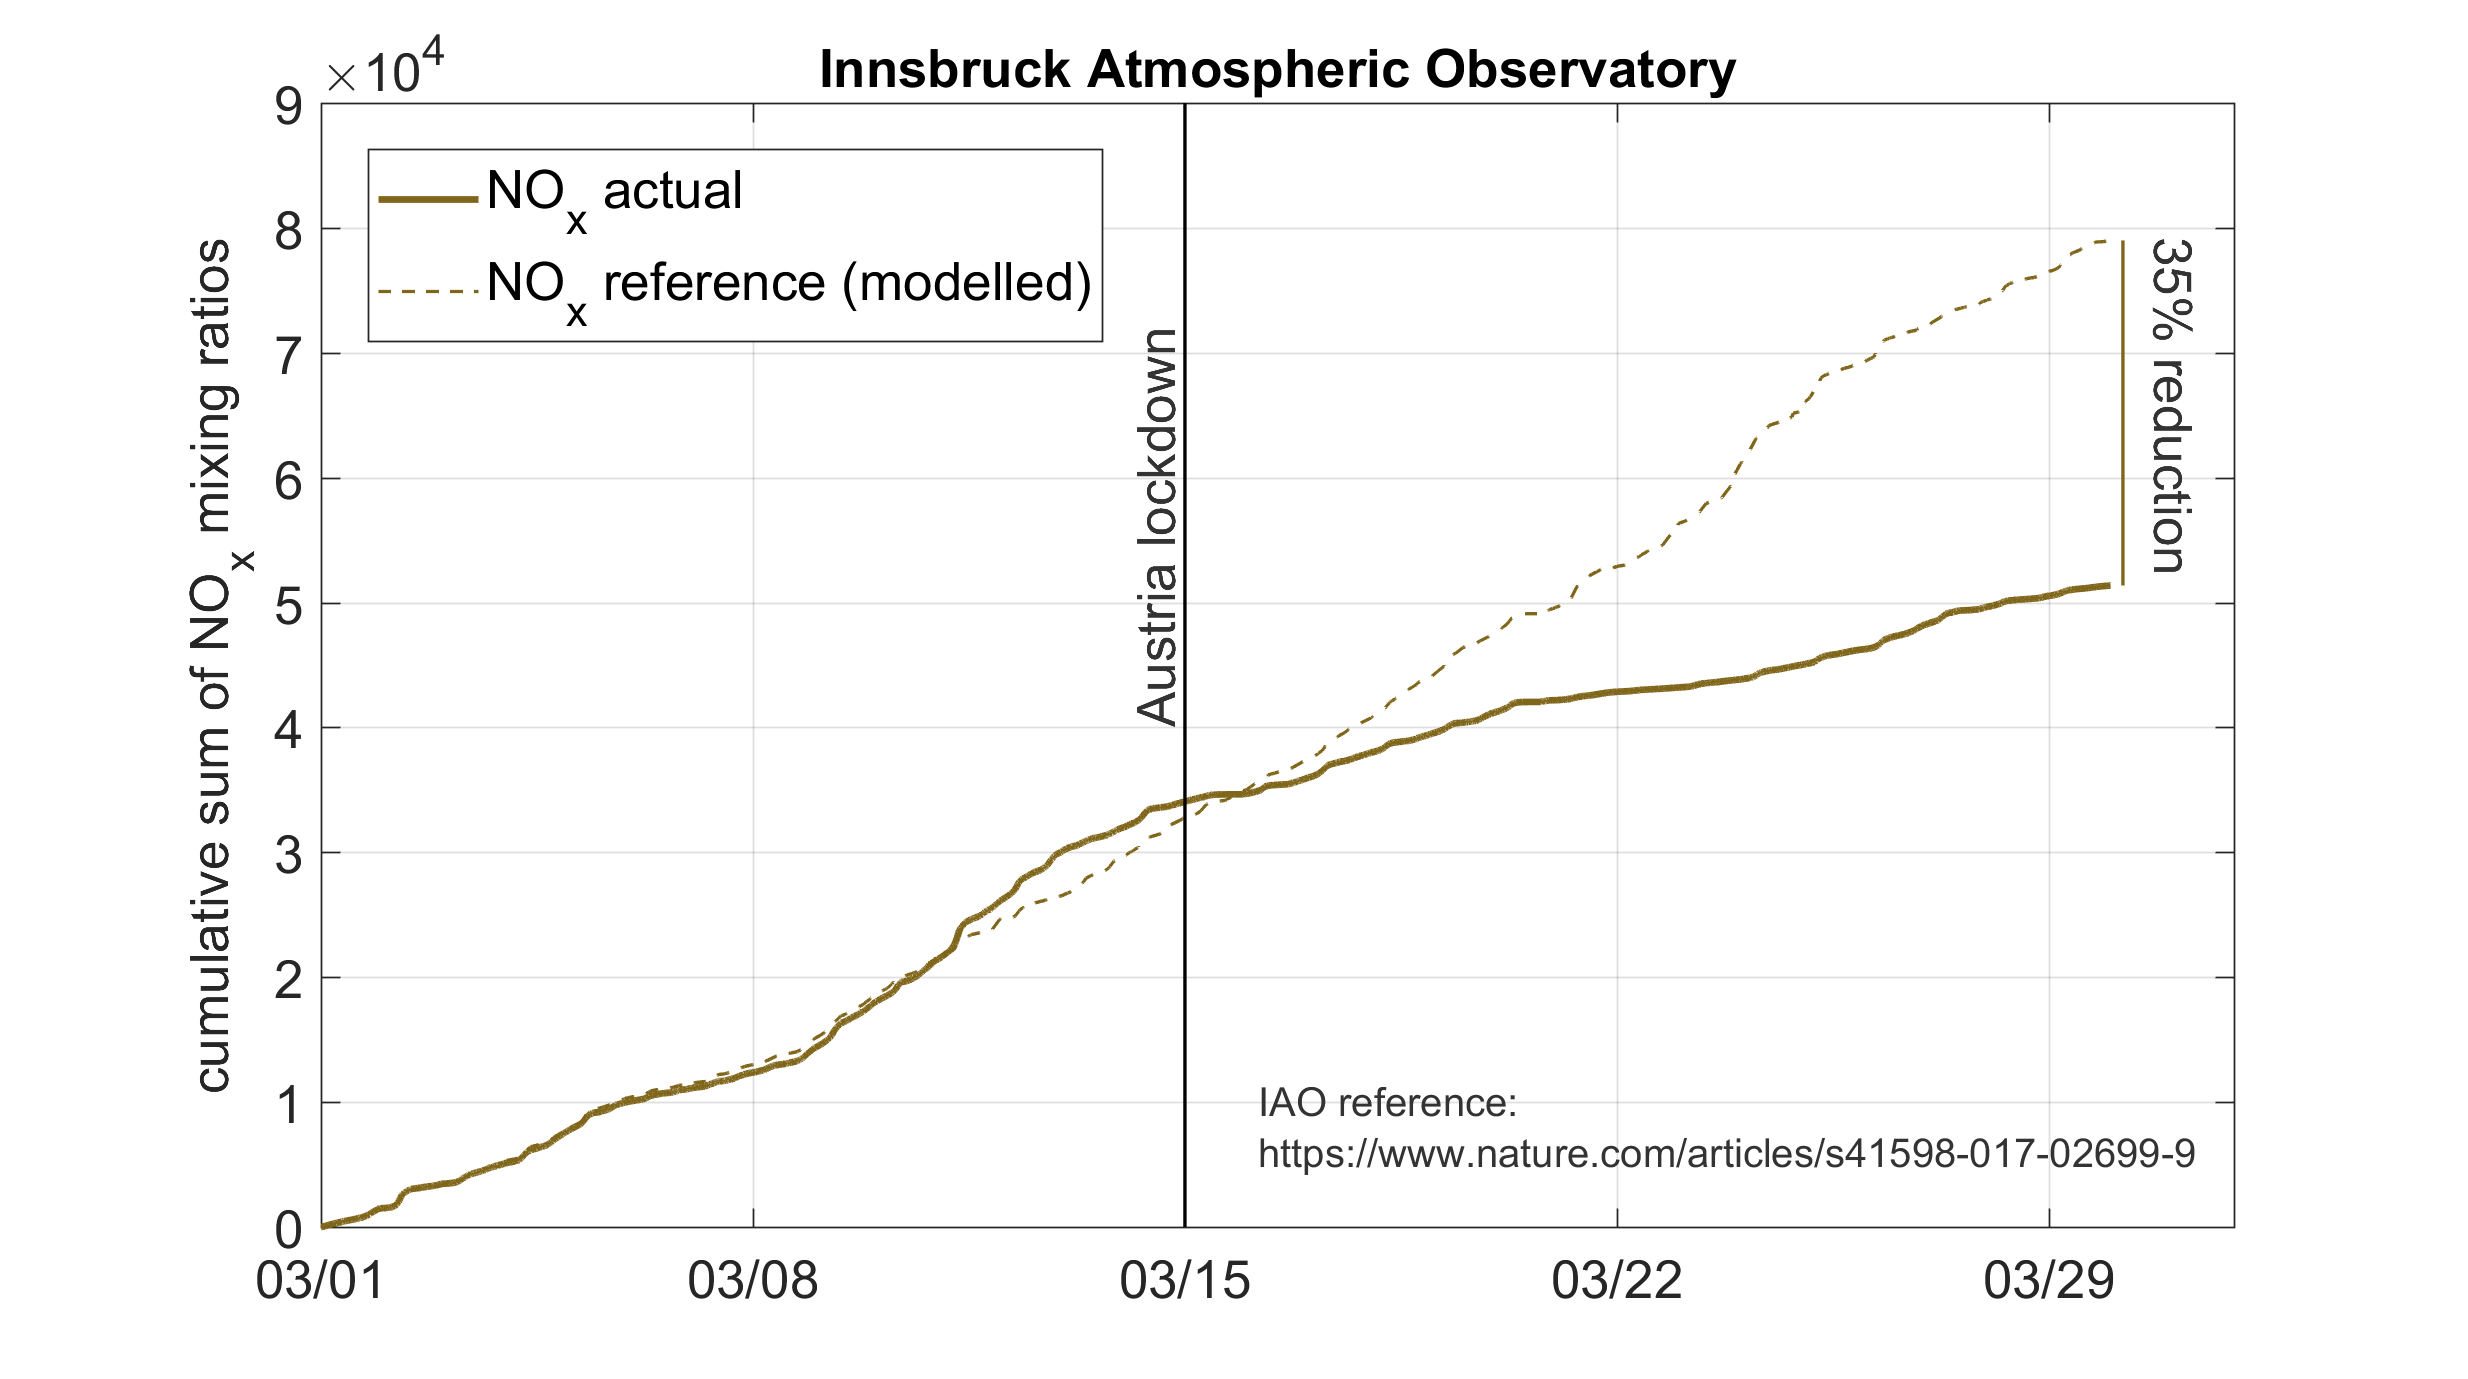
Fig 5b: Preliminary reduction of NOx mixing ratios during the first 2 weeks of lockdown. Site reference: https://www.nature.com/articles/s41598-017-02699-9
Current remote sensing observations
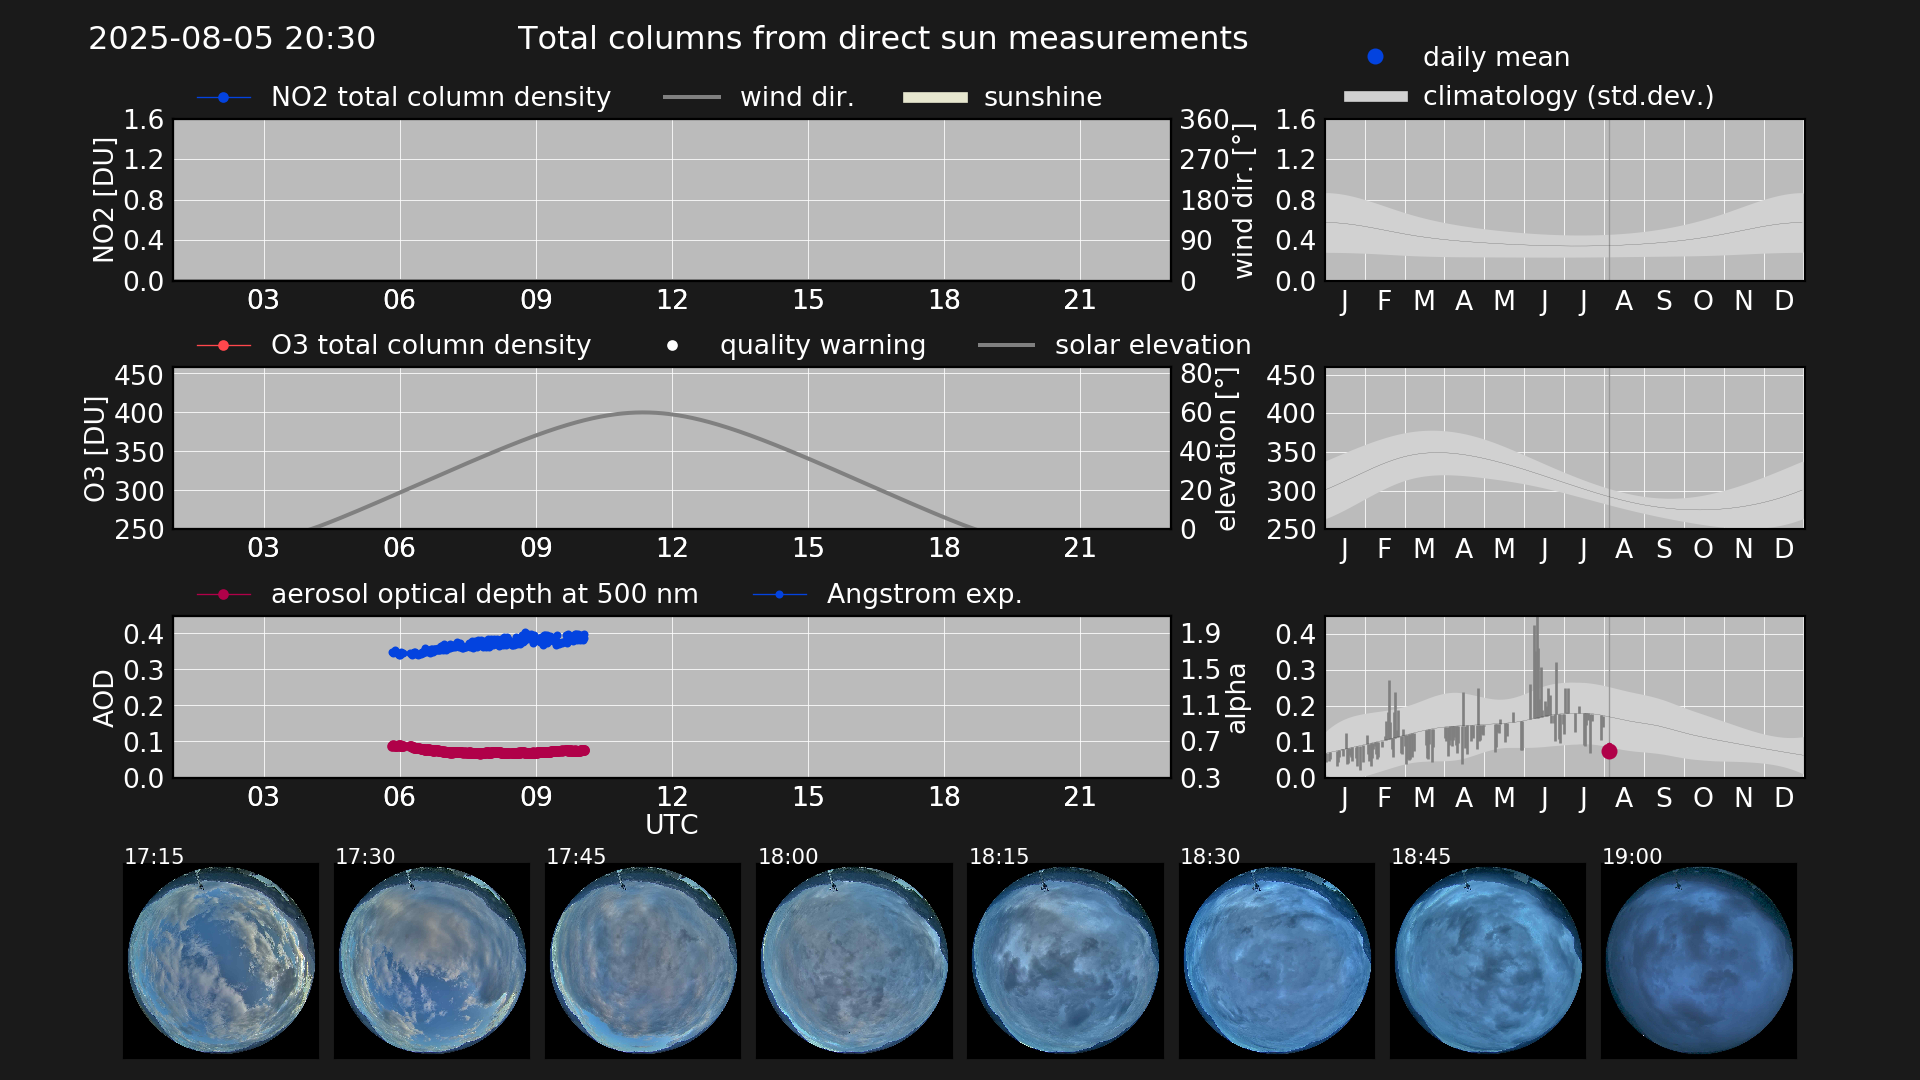
Fig. 6: Current total columns of NO2 and O3 retrieved from a Pandora-2S, and AOD and cloud coverage in Innsbruck. data source: http://www.pandonia-global-network.org
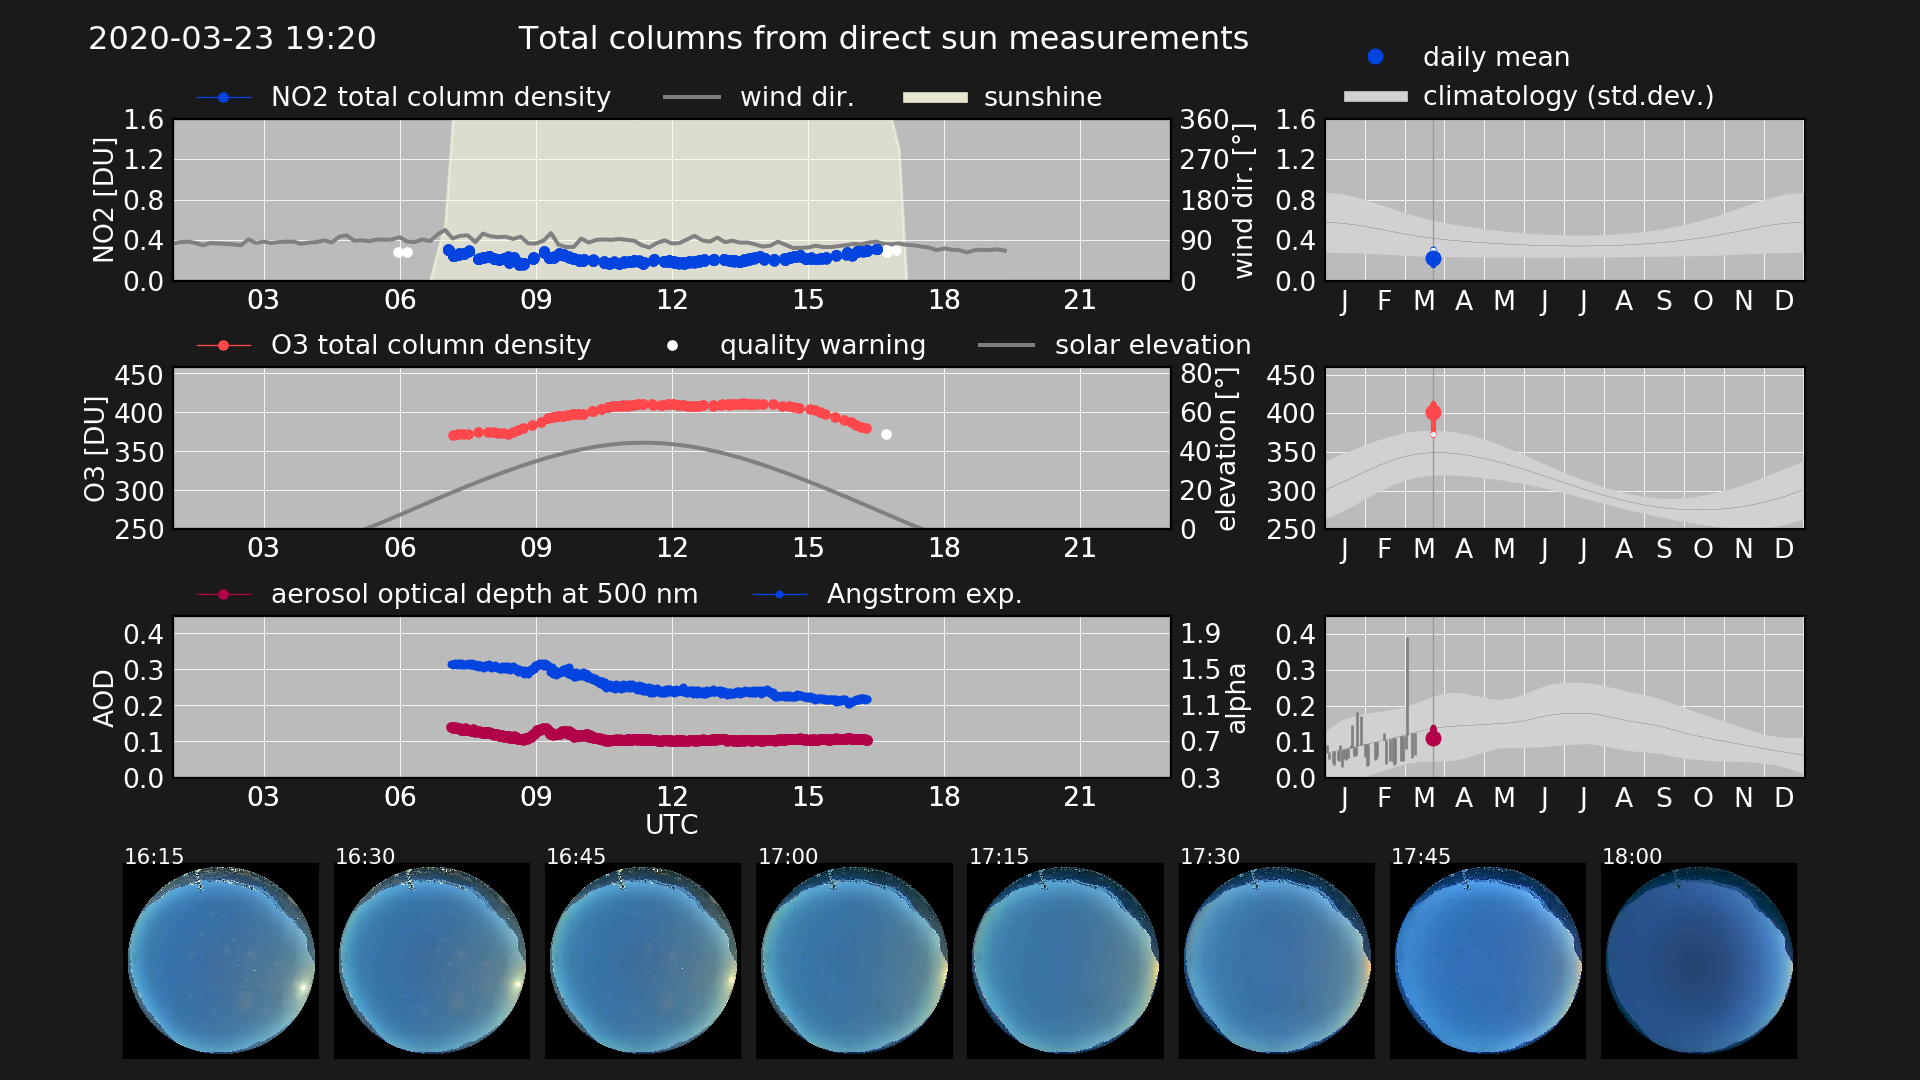
Fig. 7a: Lockdown Reference day: total columns of NO2 and O3 retrieved from a Pandora-2S, and AOD and cloud coverage in Innsbruck on 23-3-2020. data source: http://www.pandonia-global-network.org
Comparison between in-situ ground based and remote sensing NO2 changes
 Fig. 7 b: Comparison between insitu and remote sensing NO2 observations at the IAO
Press release (German): https://www.uibk.ac.at/newsroom/verkehrsbeschraenkungen-stickoxidwerte-stark-gesunken.html.de
NOx / NO2 mixing ratios vs NOx emission fluxes

Fig 7c: Diurnal cycle of NOx fluxes vs NOx/NO2 mixing ratios (approx. 2 years of aggregated and QAQC controlled data)