
Synopsis: RANS type AQ models overpredict ozone under high NOx conditions. This particularly pertains to urban areas. We measured turbulent fluxes of NOx, and O3, among other tracers, and found a likely explanation.
Leighton has summarized the photochemical steady state between O3, NO and NO2 according to:
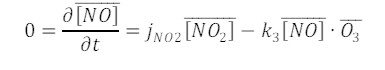
which yields a solution for the photochemical state (PSS):
![]()
From longterm O3 and NOx flux observations in an urban area, we observed a dependence of a systsematically lower ratio with increasing negative O3 fluxes (Karl et al., 2023, https://www.science.org/doi/10.1126/sciadv.add2365)
In the surface layer close to NOx emission sources, the ozone flux is controlled by the availability of NOx. The exact budget equation can be formulated as following;
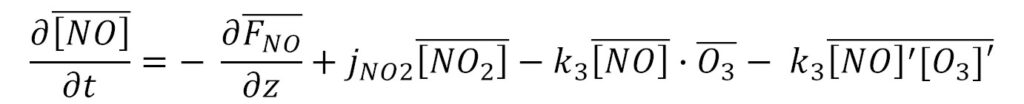
Assuming steady state (left side =0), one can obtain a physically correct formulation of the O3, NO and NO2 triad. Two terms are typically ignored (first term on the right side, and last term on the right side in the equation above).
How important are these terms?
(1) Turbulence measurements are able to constrain the last term (related to the segregation of chemical species), which is defined as:
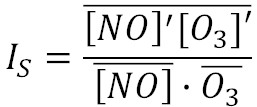
The measured and modelled (using SOMCRUS: https://doi.org/10.5194/gmd-9-979-2016 ) segregation term is on the order of 1-7% shown in the following figure:
The intensity of segregation is larger in an urban area than for a homogeneous emission assumption (SOMCRUS). It is on the order of 1-7% (average = up to 4%) and likely plays a minor role. This leaves the flux divergency term as a second possible explanation of the dependence of the PSS ratio on imbalances in the budget equation:
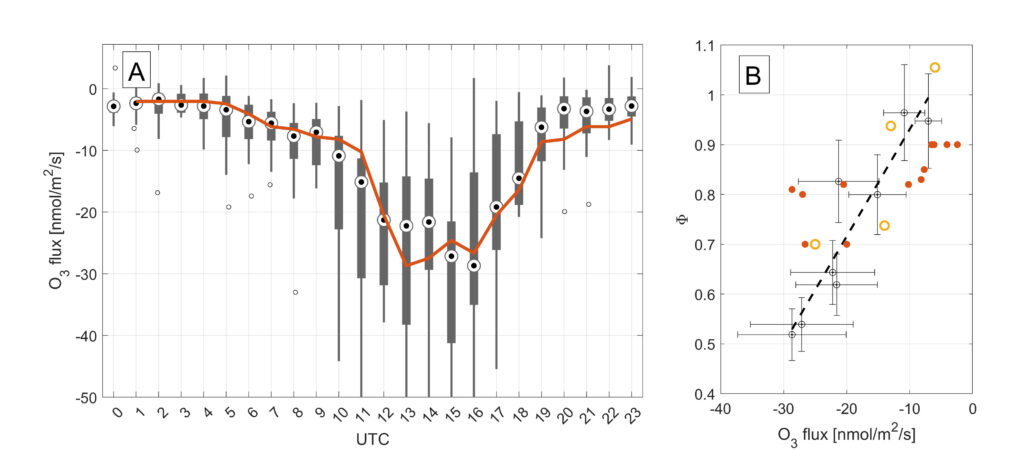
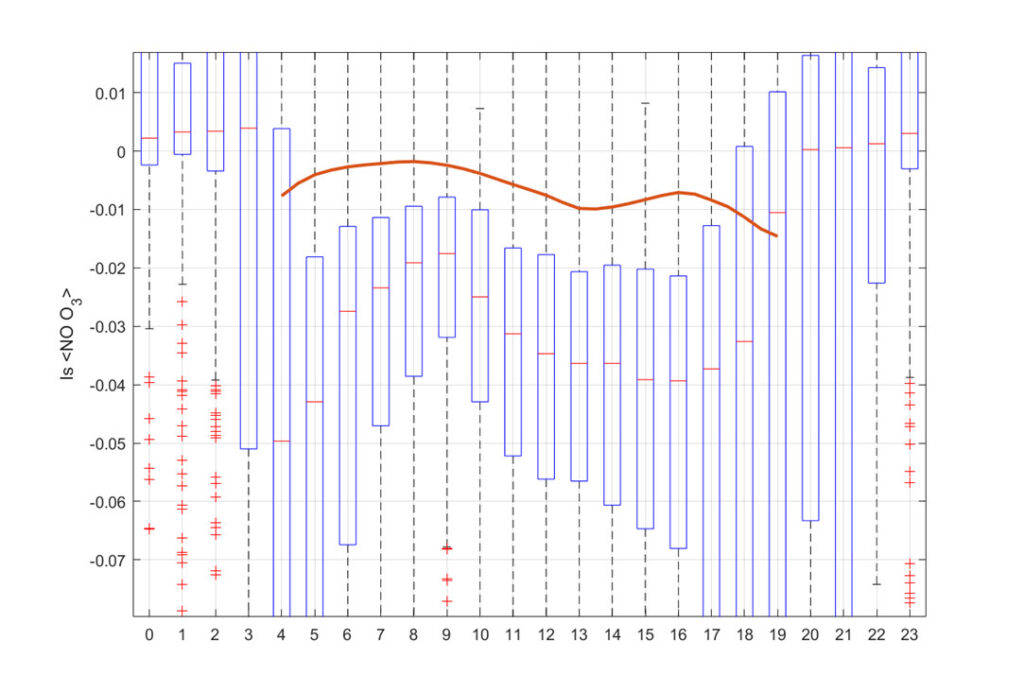
(2) The ozone flux observations (Fig. 1) already indicate that the flux divergence of NO is significant. We have expanded this analysis by performing O3 flux observations at two distinct levels that were 4 m apart on top of the IAO flux tower:

The significant flux divergence of O3 in the surface layer above high NOx emission sources (such as metropolitan areas) is in line with expected fast chemistry, and leads to a significnat deviation of the PSS. This in turn could bias modelled O3 close to the surface, where AQ measurements are typically performed . We can use a modified Leighton ratio as a metric to investigate the deviation from PSS in different areas across European metropolitan areas.
The following modelled data were obtained from CAMS (https://atmosphere.copernicus.eu/). Observational data were obtained from the EEA AQ network:
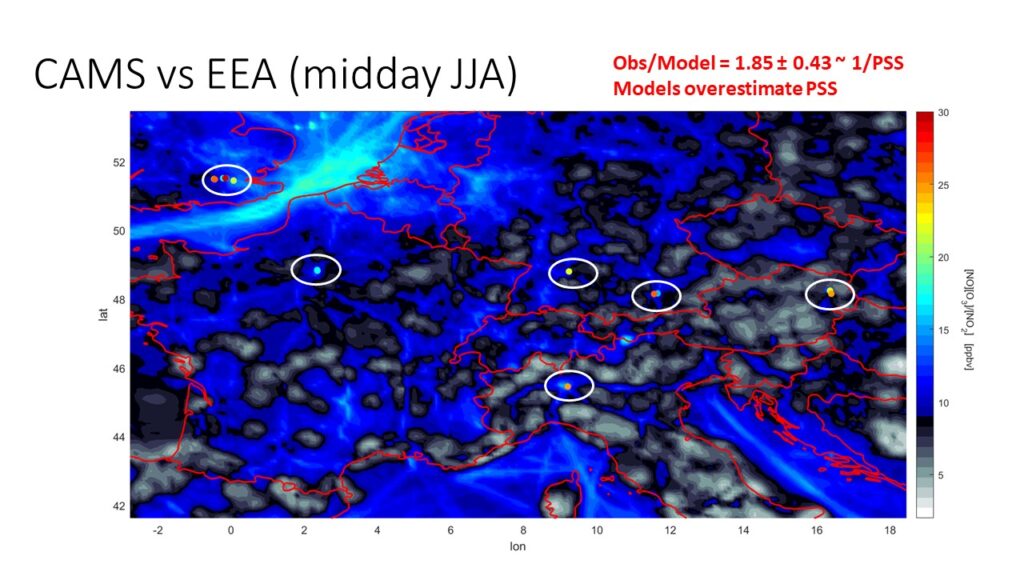
We find the following:
- Modelled NO2 is systematically high
- Modelled O3 is systematically high
- Modelled [NO][O3]/[NO2] is systematically low -> modelled PSS is too high!
- Modelled NO is systematically low (relative to NO2 and even more for NOx!)
- dF(NO)/dz is significant and a major contributor to the NO concentration gradient
(RANS type) AQ models do not explicitly account for chemical reactivity, and the associated chemistry – turbulence terms in their PBL schemes. In their simplest form these PBL parameterizations can be approximated by a simple K diffusion model. Modification due to the chemical reactions therefore provides a first estimate of a possible model bias for O3 close to the surface.
Based on measured Damköhler numbers we can calculate the deviation that would be expected from our observations at the IAO using a simple K diffusion model:
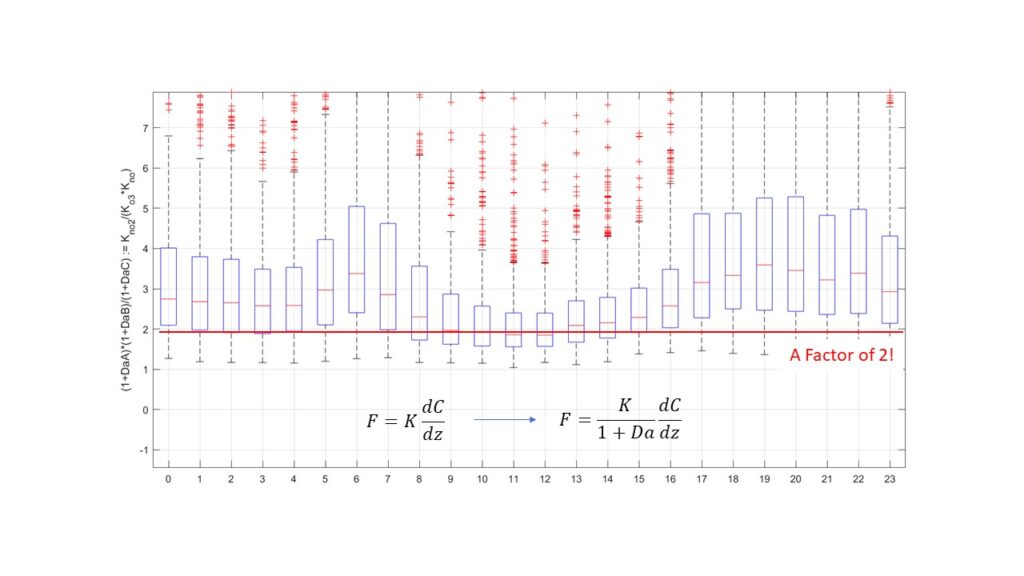
The correction factor of 2 lies surprisingly close to the modelled bias of 1.85 (see Fig 4.)
Summary: Close to the surface, fast chemical conversion between NO and O3 leads to significant flux divergence terms. The further away from NO emissions in the vertical, the smaller the term gets and the closer the system approaches PSS (Φ=1). Underestimation of reactants in the surface layer therefore also occurs independent of horizontal spatial model resolution!
How far is far enough?
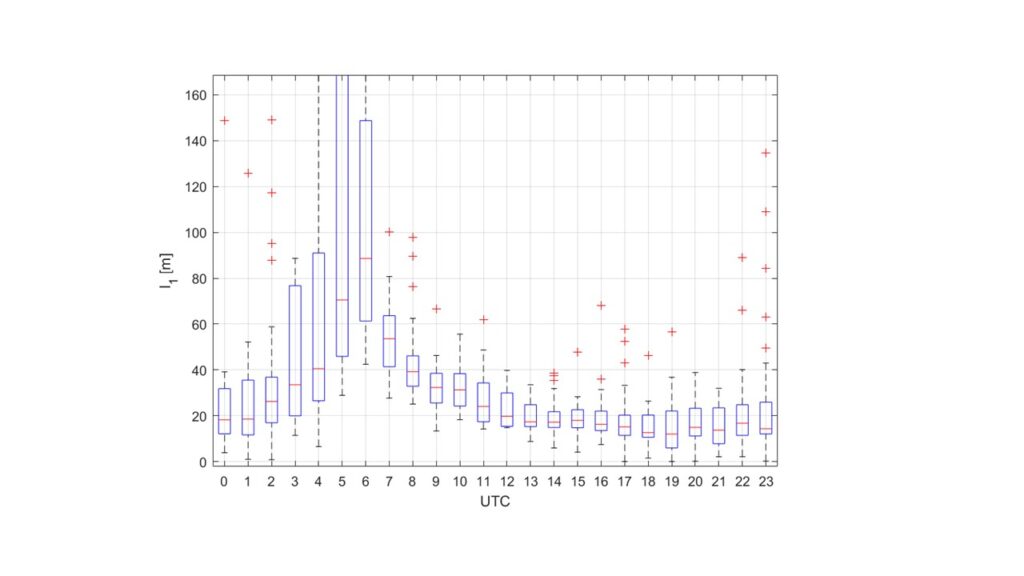
We can estimate the mixing length for the scalar reactants. From our measurements we obtained a mixing length scale of the PSS (l1) according to:

Figure 6 shows the calculated length scale for the urban area of Innsbruck.
We find that chemistry significantly influences the concentration gradient of the O3-NO-NO2 triad in the surface layer. This is a non-linear process, and in turn can lead to an overprediction of O3 close to the surface, where AQ data are typcially collected. The overprediction is a consequence of surface layer (ie. PBL) parameterization schemes, that do not explicitly account for chemistry turbulence interactions.
References:
K.W. Appel, A.B. Gilliland, G. Sarwar, R.C. Gilliam, Evaluation of the Community Multiscale Air Quality (CMAQ) model version 4.5: Sensitivities impacting model performance: Part I—Ozone, Atmos. Environ., 41, 9603-9615 (2007)
U. Im et al., Evaluation of operational on-line-coupled regional air quality models over Europe and North America in the context of AQMEII phase 2. Part I: Ozone, Atmos. Environ., 115, 404-420, (2015)
T. Karl, C. Lamprecht, M. Graus, A. Cede, M. Tiefengraber, J. Vila-Guerau de Arellano, d. Gurarie, and D. Lenschow, Science Adv., 9, doi: 10.1126/sciadv.add236 (2023)
P. Leighton, Photochemistry of Air Pollution (Academic Press, New York and London, 1961)
H. Lenschow, D. Gurarie, E. G. Patton, Modeling the diurnal cycle of conserved and reactive species in the convective boundary layer using SOMCRUS. Geosci. Model Dev. 9, 979–996 (2016).
J. V.-G. De Arellano, P. G. Duynkerke, P. J. H. Builtjes, The divergence of the turbulent diffusion flux in the surface layer due to chemical reactions: the NO-O3-NO2 system. Tellus B Chem. Phys. Meteorol. 45, 23–33 (1993)
Acknowledgement: This work was supported by ESA (Cooperative Agreement No. 4000137068/22/I-AG), the Austrian National Science fund (FWF) through grant P30600 and the National Center for Atmospheric Research, which is a major facility sponsored by the National Science Foundation under Cooperative Agreement No. 1852977.